I received a question from one of our distributors recently on what the “Best Fit Flatness TIR” numbers and “Slopes” mean in our report.
So I thought this would be a good topic to discuss here. The best way to analyze flatness data is to use the Least-Squares, Best-Fit (Best Fit or BF) data algorithm, which uses a mathematical regression formula to “best fit” a plane (or a line) to a set of data.
Why do we want to do this? Well, depending on what references you use, you can make it appear as if a surface is not flat but in fact it really is! For example, if I level my laser, zero a target and then measure a surface and find that the max deviation from zero is 0.5 mm, then I would be inclined to think that my total error is 0.5 mm. But wait, what if the surface I measured is not really level to earth? Well that changes things, doesn’t it? It could very well be flat but just not level to earth. We have seen this countless times!
The same thing can happen if instead of using level as a reference, we use 3 reference points to establish our reference plane, where one or more of those points are “bad” (sometimes called an “outlier”). This results in the laser plane being overly tilted relative to the surface and again produce flatness errors that are not really there.
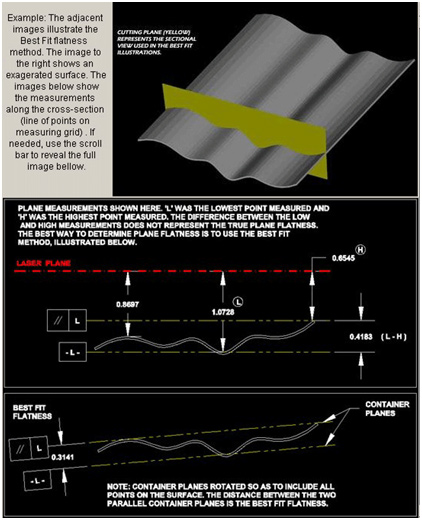
To overcome this problem, the Best-Fit plane becomes critical to getting good flatness results. The output of a Best-Fit analysis is: i) a maximum Flatness TIR value and ii) X&Y slopes of the Best-Fit Plane. What do these values mean when using lasers?
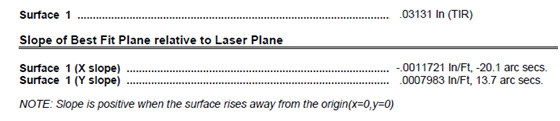
• Best Fit Flatness TIR – is the maximum deviation (Total Indicated Runout) of all the recorded data points from the Best-Fit Plane. It is the true measure of flatness and essentially subtracts any effects slope in the laser plane from bad reference points will have on the data. Here is a definition from our Plane5 software:

So in the case above where I talk about the surface not being flat to 0.5 mm using level as a reference, if the Best Fit analysis were to be used, you might see something like a TIR flatness of 0.075 mm with significant X&Y slopes (see below) in the BF plane. This means the actual flatness of the surface is 0.075 mm but it is not level to earth to 0.5 mm. If you have a spec of 0.10 mm flatness, then using the BF analysis would mean that the surface is in spec but just not level to earth. Think about how much time you could waste trying to bring this surface back to earth level!
• Best-Fit Slopes – This is deviation in angle of the Best-Fit Plane from the laser plane in the X & Y axes. In essence, this shows you how close the reference points that you used to measure the surface flatness are to the other points on the surface. The bigger the slopes, the worse the laser setup was.
So in our example, if the user used earth level as a reference, then the slopes of the BF plane will tell you how far from earth level the surface is.
The BF slopes can also tell you if the user did not buck-in (make parallel to) the laser to the reference points very closely. So if you see a large BF flatness error and also large BF slopes, this probably means that the end user was not careful with his setup.
One final point on BF slopes. They are typically not used very much unless you are measuring parallelism, where they become very important because the only way to truly measure parallelism is to compare the BF plane of one surface to the second surface. The difference between the 2 BF planes tells you the parallelism between the surfaces. For reference, Plane5 can do that with ease!
Plane5 Report
Another question from the distributor was: what are the “Z Raw Flatness Data” and “As Configured/Plotted” columns in the Plane5 mean?
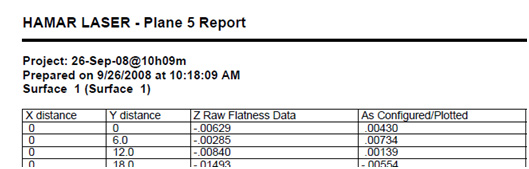
The values in the Z Raw Flatness column are the actually recorded values or the “raw” data. The As Configured values are the values corrected for the plot reference chosen in Plane5 (Laser Plane or the BF Plane).
If BF Plane is chosen, then the numbers under the column As Configured/Plotted are the alignment values RELATIVE to the BF plane, or in other words, these have been “corrected” so they show the alignment relative to the BF plane. Basically the BF slope is subtracted from each point to obtain the As Configured number. This is the true flatness value for that point.
A Practical Tip when Using Best Fit Analysis:
Some might be tempted to use the Best Fit analysis to save time on setups. This can work but be WARNED that this can lead to big flatness errors. The main problem is if you do not buck-in the laser very well, then you have to be very accurate with the dimensions of the layout of the points on the surface. You also have to be very accurate with the placement of the target on each point. For example, if your laser is bucked in only to 0.1 mm/100 mm and you are off by 15 mm, then you have a 0.015 mm of error due to the slope in the laser. This would be a big problem if your tolerance is 0.01 mm!
What the BF analysis can do is allow you to be a little “looser” with your buck-ins, so instead of bucking-in to 0.001 mm, you can buck in to 0.01mm or 0.05 mm, which is MUCH easier to do! This will save a lot of time on your setup.